The Weekend Edition includes a market update plus Morningstar adds links to two additional articles.
Weekend market update
On Friday in the US, Treasurys came under moderate pressure with yields rising by three to five basis points across the curve, while stocks cruised through a sleepy session with the S&P 500 finishing unchanged and the Nasdaq slightly higher. WTI crude ticked towards US$63 a barrel, gold edged higher to US$3,643 per ounce, bitcoin jumped above US$116,000 and the VIX stayed below 15.
From AAP:
Australia's share market on Friday clawed back most of the week's losses, as materials and banks rallied to help end the week on a high.
The S&P/ASX200 rebounded 0.68% to 8,864.9, as the broader All Ordinaries jumped 0.63% to 9,128.7.
The top-200 finished the week roughly six points lower, or down 0.07%.
Six of 11 local sectors finished the day in the green, led by financials, materials and real estate stocks, which each gained between 1.2% and 1.5%.
All big four banks rallied at least one per cent higher, led by Westpac (up 1.4%), and CBA, which surged 1.3% to $169.97, helping the broader sector close 0.4% higher than a week ago.
A push in BHP shares to $40.81 buoyed the materials sector, almost wiping the week's losses as iron ore miners rallied on reports Beijing plans to address local government balance sheets, which could unlock more infrastructure funding.
ASX-listed gold miners continued to shine, with Newmont and Evolution up more than 2% each and Northern Star gaining 1.6%.
Energy stocks slipped 2.4% after US crude demand and global oversupply concerns snapped a three-day winning streak for oil prices.
Woodside shares slid 3.4% to $24.22, despite the company winning federal environmental approval to extend its North West Shelf gas project by 40 years.
The real estate sector also benefited from the rally in cyclicals, as Goodman Group added 2% and Scentre, Mirvac and Stockland all gained 1.4% or more.
IT stocks improved by 0.6% as Megaport lifted 0.8% on broad market strength to $94.93, despite going ex-dividend.
Companies including Qantas, Cochlear, A2 Milk and South32 will go ex-dividend next week.
From Shane Oliver, AMP:
Global shares rose over the last week buoyed by expectations for rate cuts in the US. This saw US shares rise 1.6% and Japanese shares rise 4.1% to new record highs and Chinese shares rise 1.4% to a new recovery high. Despite the latest political upheaval in France, French and wider Eurozone shares (up 1.6%) also rose for the week, as worries about France proved to be another case of sell on the rumour and buy on the fact. Despite a positive US lead the Australian share market fell for the second week in a row but only by 0.1% with gains in IT, property and utility shares offset by losses in energy, consumer and industrial shares. 10-year bond yields rose in Europe and Japan but fell in the US, UK and Australia. Gold prices rose to another new record high on a combination of expectations for more Fed rate cuts and a weaker $US and on the back of demand for a hedge against public debt worries. Oil, metal and iron ore prices also rose. The $A broke decisively above US$0.66 rising to its highest since November last year as the $US fell.
Fed set to resume rate cuts next week as US inflation was in line with expectations clearing the final hurdle for a resumption of cuts. Core CPI inflation at 3.1%yoy in August is consistent with core private final consumption inflation running around 2.9%yoy. This is higher than the Fed’s 2% target and upside risks remain on the tariff front, but the Fed will take comfort that inflation expectations mostly remain well anchored and increasing signs of labour market weakness are now dominating concerns about the impact of the tariffs. This was evident again in the last week with the Bureau of Labor Studies estimating that payrolls were significantly lower than previously reported, adding to evidence that the labour market is slowing. Given all this we expect the Fed to cut rates by 0.25% on Wednesday (with a 20% chance of a 0.5% cut) and signal two more cuts this year and two more next year.
For Australia, the Fed’s likely resumption of rate cuts is positive for the Australian dollar and will marginally increase pressure on the RBA for more rate cuts. Money markets now see the Fed cutting by more than the RBA which will push US short term rates below the RBA’s cash rate. Historically, a rising gap between Australian and US rates has tended to see a rising trend in the Australian dollar (see the arrows in the next chart) and its break above $US0.66 may be a tentative sign that it is moving higher. Its also undervalued versus the $US (with fair value around $US0.73) supporting more upside. Since the GFC the RBA has not always moved rates in line with the Fed, eg in 2009 it started hiking when the Fed held rates low and over 2016-2018 it held rates down as the Fed hiked so just because the Fed is easing doesn’t mean that the RBA will blindly follow. But if the $A heads significantly higher this may add pressure on the RBA to cut by more than the market is expecting because a rising $A will dampen local growth and inflation. And if the Fed is cutting because of a weakening US jobs market and economy it may also add to pressure for more rate cuts here as weaker US growth will impact global and Australian economic growth. For now, our base case remains for 0.25% RBA rate cuts in November, February and May.

Source: Bloomberg, AMP
****
A few months ago I had a debate with a prominent Australian economist who said that given the performance of US shares versus Emerging Markets over the past 15 years that super funds and investors would be silly to bet against that trend continuing.
I took issue with it because I thought it was a little naïve to base predictions for the future on what’s happened over a relatively short timeframe of 15 years. And it was a timeframe where US shares had performed spectacularly and Emerging Markets less so, dragged down by China whose economy had experienced recessionary-like conditions for several years.
This economist’s views though have been echoed by investors in Australia. Most of the major super funds are continuing to pour money into the US, and individual investors are too.
In August, international share ETFs in Australia received the highest flow of funds with $2.4 billion, followed by fixed income ($1.2 billion) and Australian equities ($823 million).
It’s part of a longer trend of money going into international equities. And given US stocks are around two-thirds of global indices, most of the funds are being invested in America.
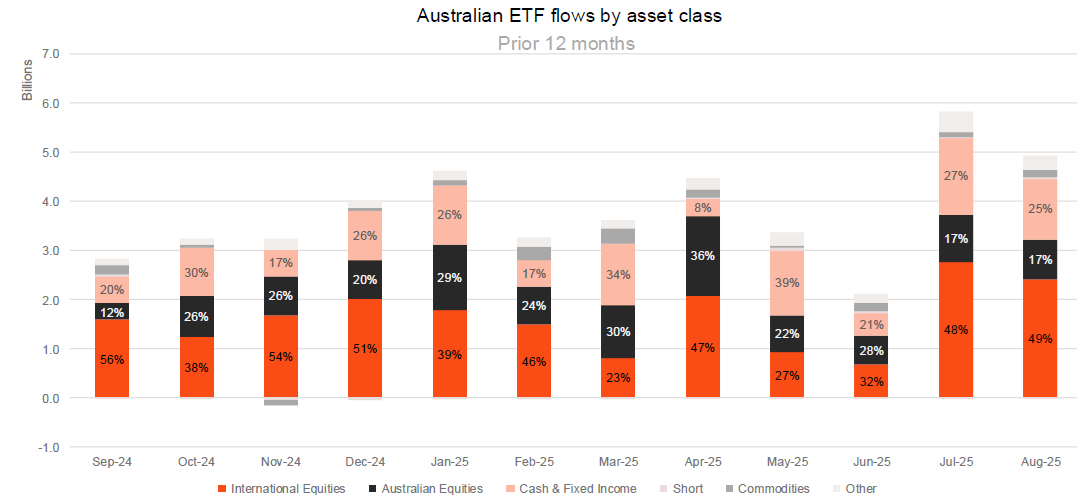
Source: Betashares
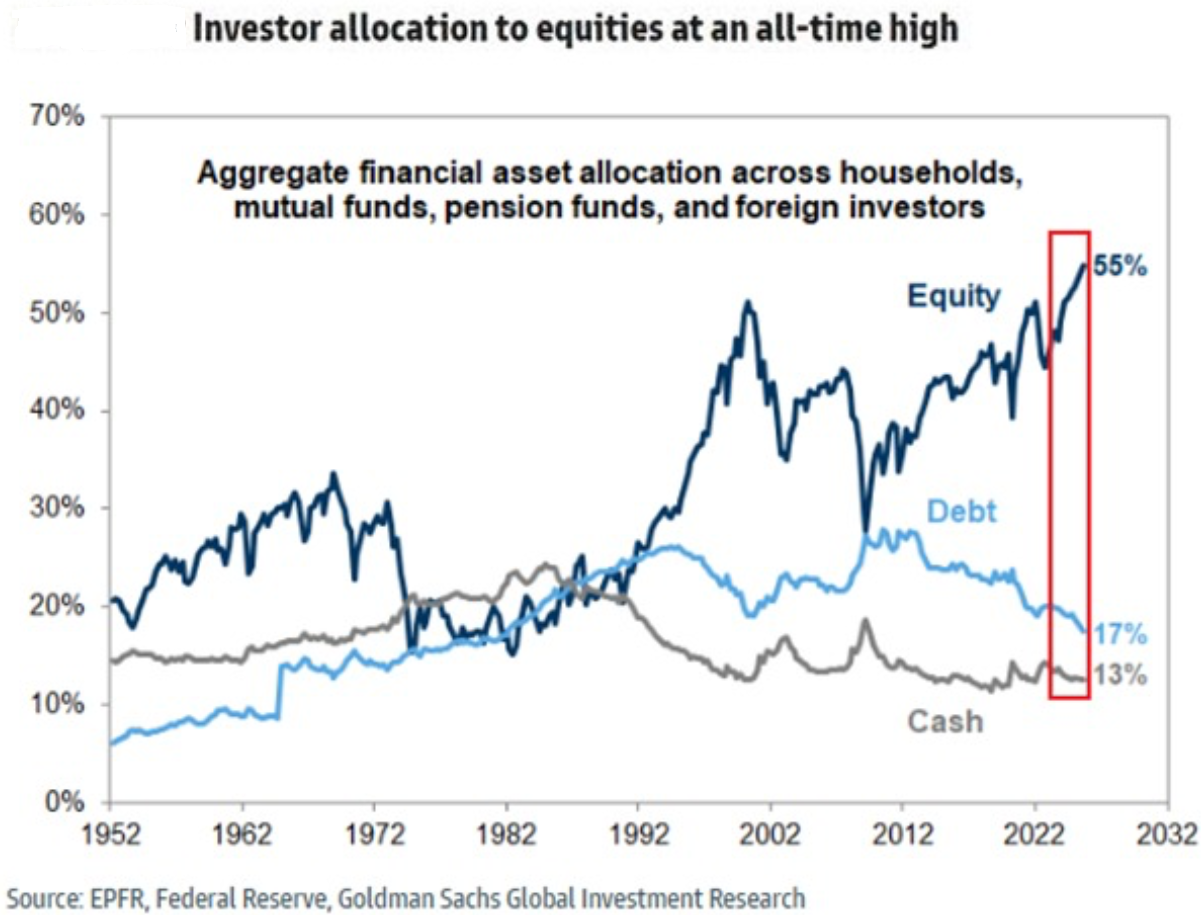
It’s not just Australian investors who are betting on US shares either. American investors themselves are seemingly all in.
Zooming out on returns
Some of you may be surprised by my comment that 15 years is too short a timeframe to judge returns. I like to look at performance over many decades as it provides more context for current markets and what may happen in future.
Yet even over the long term, US market returns stand out.
Total returns per annum in AUD
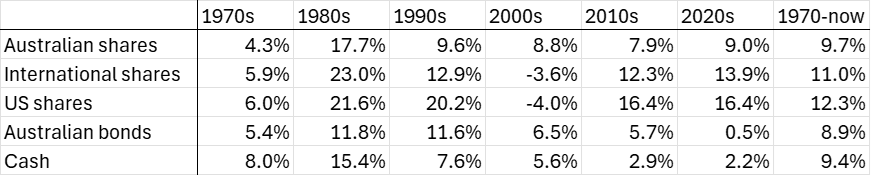
Source: Vanguard, Firstlinks
Since 1970, the S&P 500 has returned 12.3%, international shares 11% and Australian shares 9.7%. $10,000 invested in US shares in 1970 would be turned into $5.7 million, for international shares it would have turned into $2.3 million, and for Australian shares it would have turned into $1.7 million.
It’s amazing how relatively small differences in annual returns result in large discrepancies in total returns. That’s the power of compounding!
Another thing to note from the chart is how good US returns have been since 2010. Both the last decade and this one have produced returns of 16% per annum. That’s way above the annual return of close to 10% over the past century.
It’s also apparent how volatile US market returns are. The 1970s were poor, especially when adjusted to high inflation. In fact, cash easily topped equities during that period.
Yet the 1980s and 1990s saw amazing returns for stocks, especially in the US. Then that was followed by an awful decade in the 2000s which delivered negative annual returns from US shares, thanks to the internet bust and 2008 financial crisis.
In comparison, Australian share returns have been less volatile. This decade’s 9.7% annual returns are slightly below the 10.4% recorded since 1900, yet they’re still reasonable.
Overall, however, US shares have been stand-outs when it comes to performance since 1970.
The big question is: will it continue?
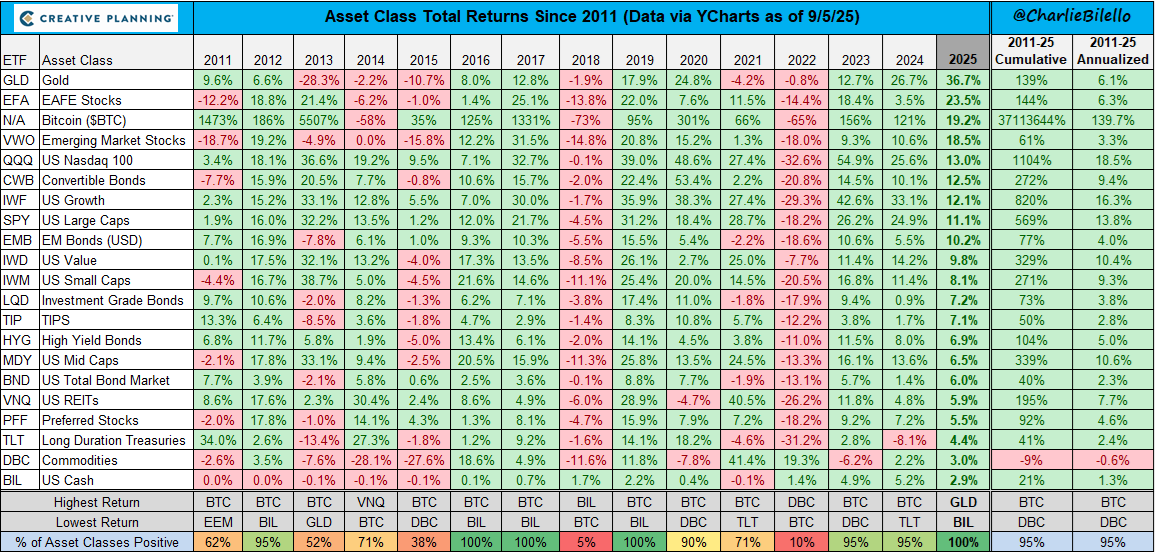
What’s interesting this year is that for all the hoopla over AI and the Magnificent Seven, US shares have badly trailed international shares and emerging market shares. So, emerging market stocks are up 19% in USD terms year-to-date (YTD), helped by a 34% return from China. That compares to YTD returns from the US of 11%. Australian shares too have outperformed America both in local currency and USD terms this year.
Drivers of US returns
To assess whether past US returns are sustainable going forward, let’s dig into the key drivers of returns. Namely, earnings and valuation multiples.
On earnings, S&P 500 forecast EPS growth is 9% this year, followed by 14% in 2026 and 12% in 2027. That’s well above the average of 7.3% since 2001.
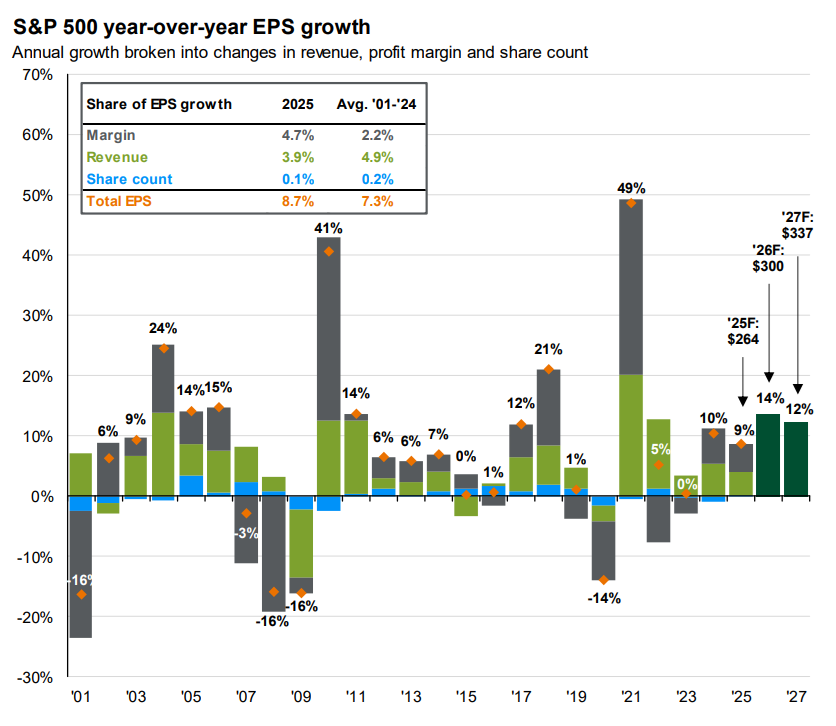
What’s fascinating is that revenue growth is expected to slow this year, yet margin improvement is predicted to contribute more than half to total EPS growth.
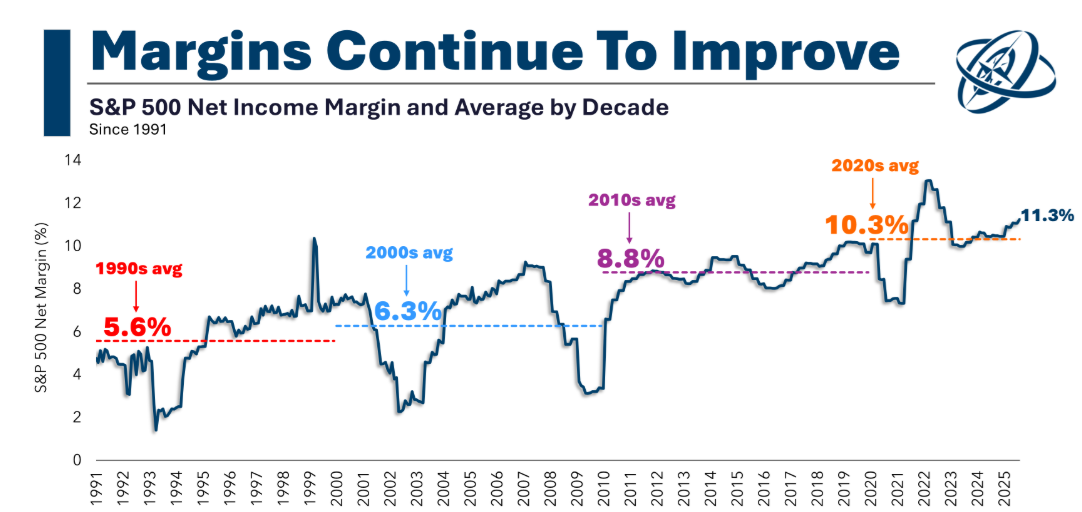
Higher margins aren’t just a this year story. US margins have more than doubled since the 1990s.
It’s been driven by many trends, including the rise of high-margin tech behemoths, including the Magnificent Seven.
Source: Ritholtz Wealth Management
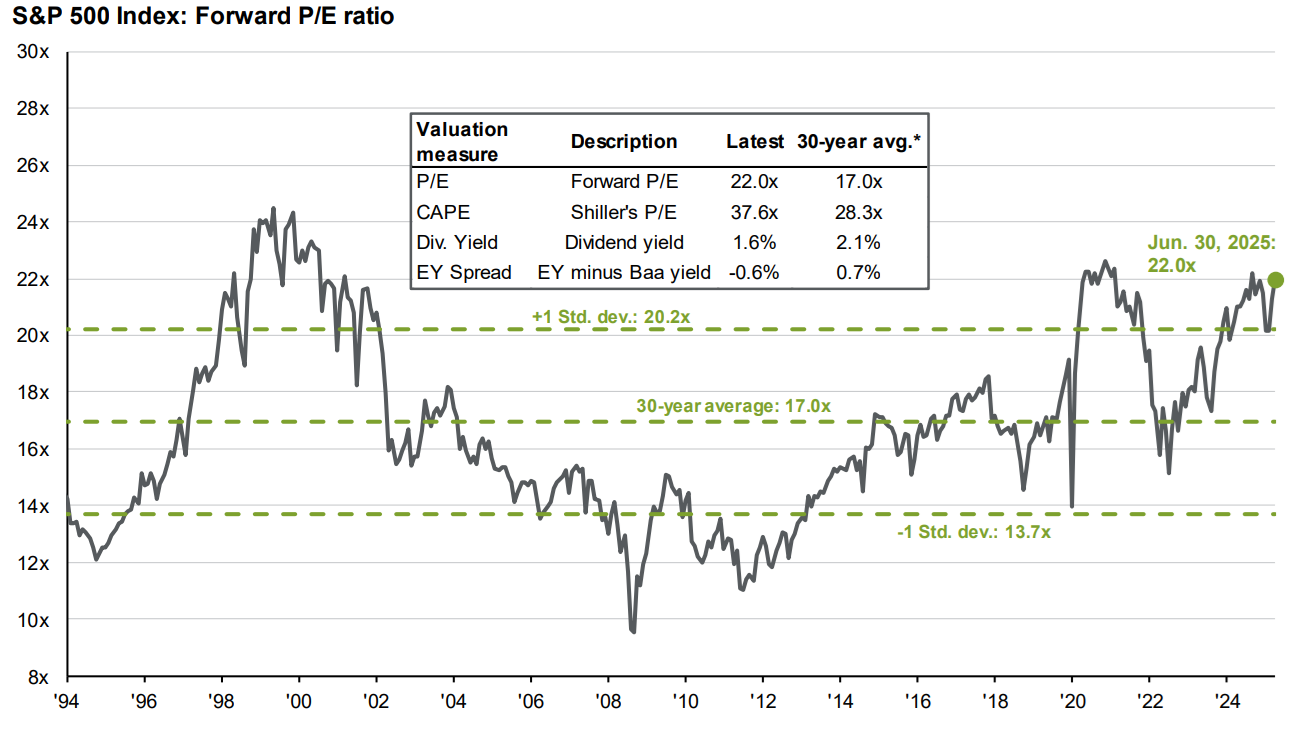
The other big factor in stellar US performance has been an expansion in valuation multiples attached to the market. Bottoming at 10.4x price-to-earnings (P/E) in early 2009, the S&P 500 is now trading at a forward P/E ratio of 22.
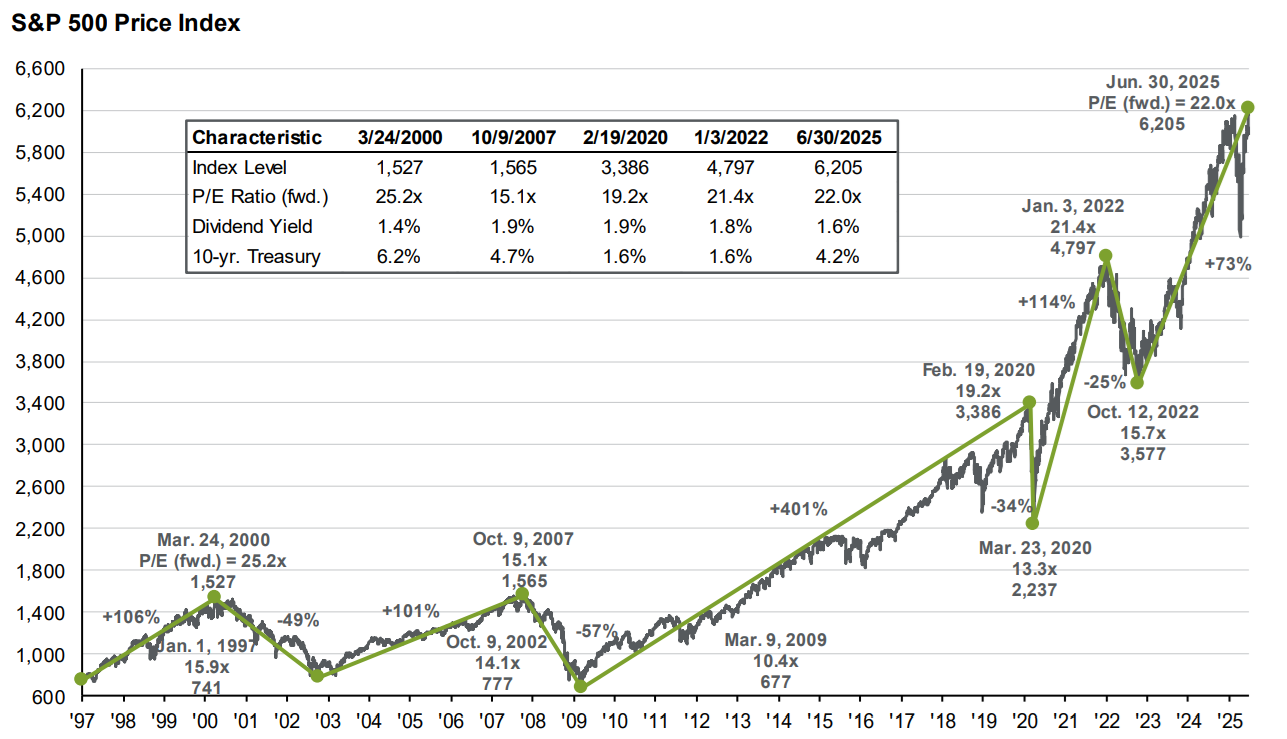
US market prices look extended no matter which valuation method you use.
Source: JP Morgan Asset Management
When valuations are this steep, it normally doesn’t augur well for future returns, especially over longer timeframes.
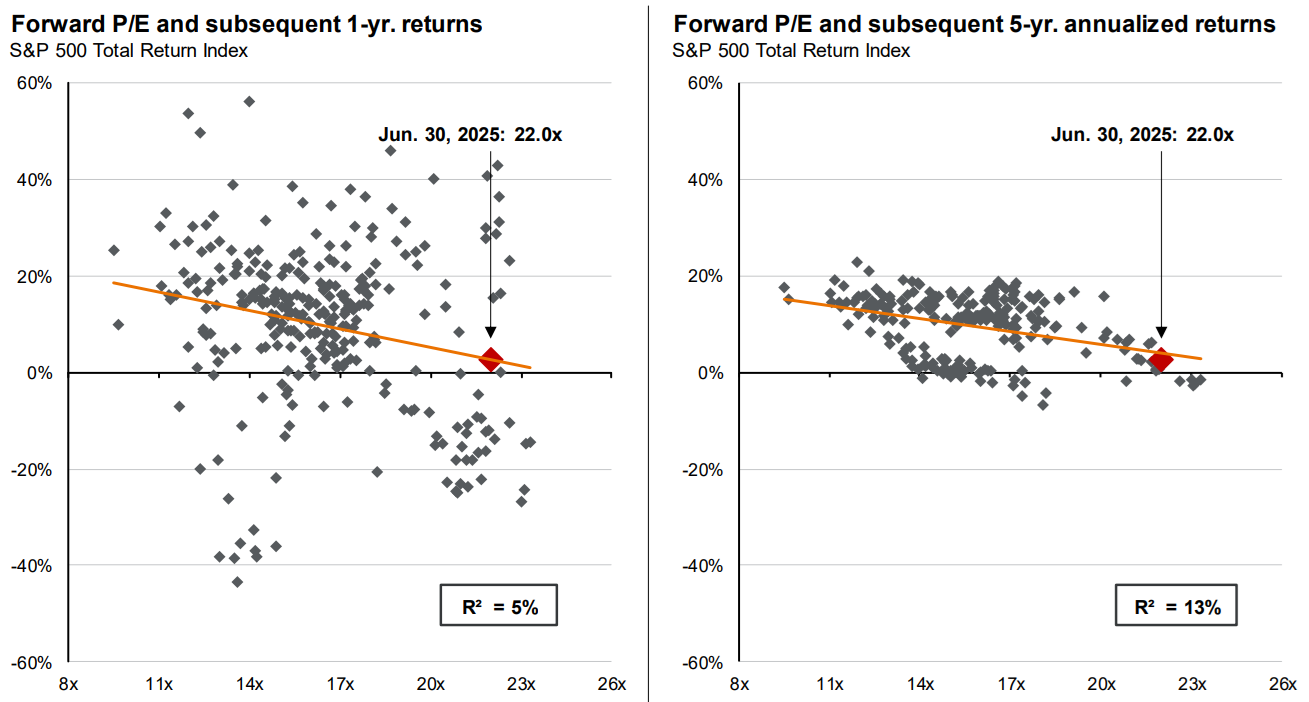
Source: JP Morgan Asset Management
Even assuming a relatively benign outcome of flat margins and P/E ratios would mean US returns of low-to-mid-single digits over the next 5-10 years. It would need a sustained boom in earnings, perhaps led by AI, to prevent that from happening.
How the rest of the world looks
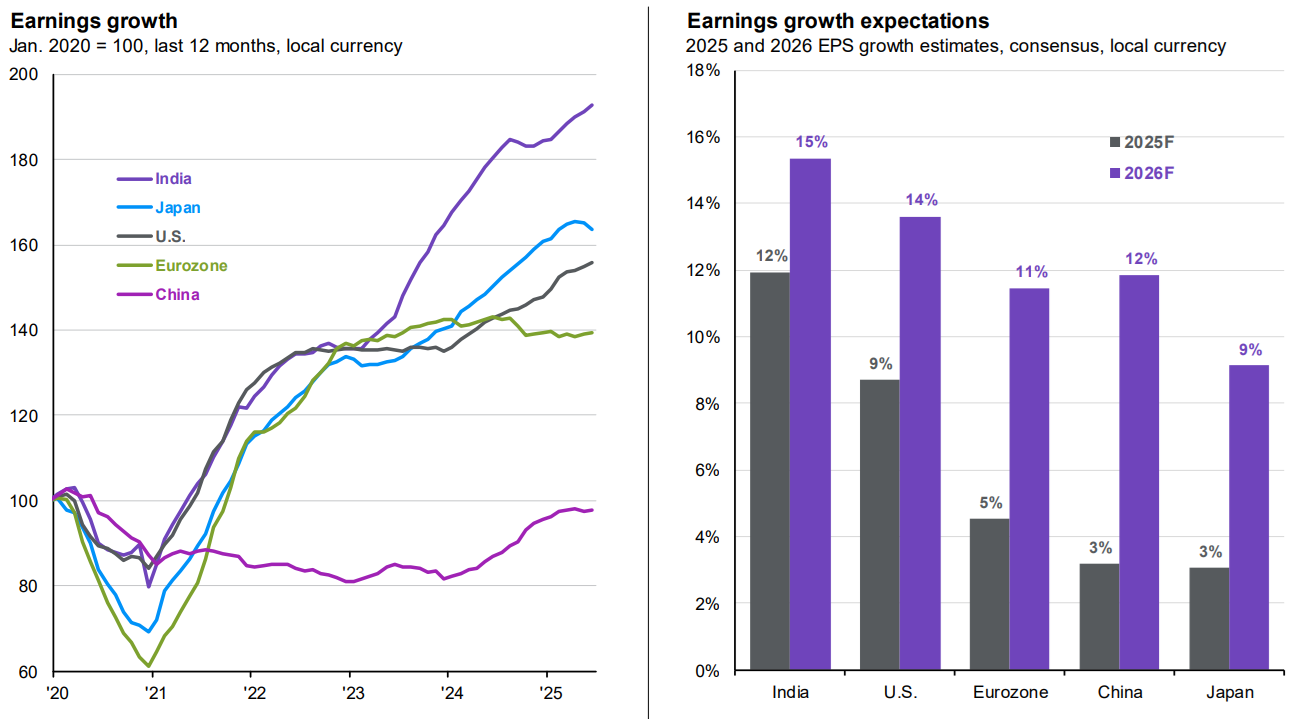
Believe it or not, while US earnings have been great, they’ve trailed the likes of India and Japan this decade. And while Europe and China earnings haven’t been healthy, they’re also forecast to pick up over the next year.
Source: JP Morgan Asset Management
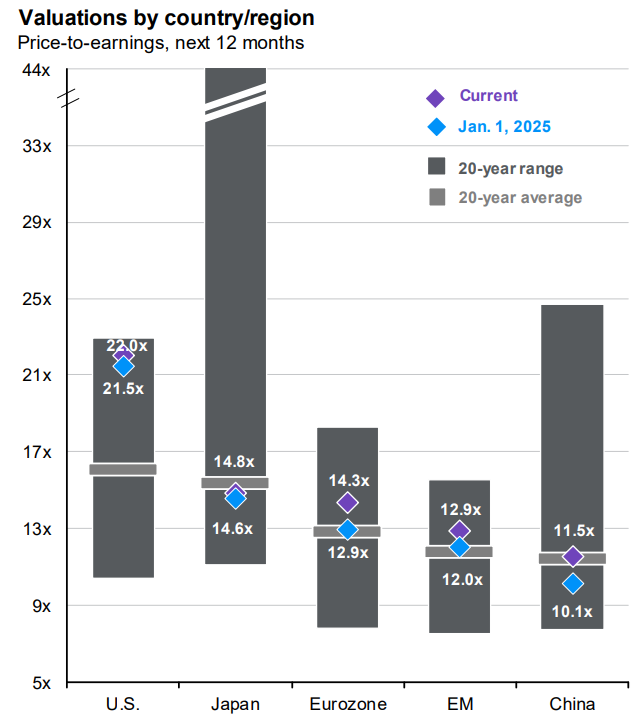
And the price that investors are paying for earnings in the world ex-US are much cheaper. Japan and China especially appear inexpensive.
Source: JP Morgan Asset Management
What about Australia?
Australia is a different case. 2025 is expected to be the third year in a row where the ASX 200 delivers negative earnings growth. The poor record has been driven by pedestrian profits from the banks (is it any wonder why they are now on a cost cutting exercise?) and mining earnings falling sharply due to commodity prices retreating.
The consensus forecast is for earnings to increase by 4.5% next year, though this number can’t be trusted as stockbrokers are always too bullish on their profit forecasts.
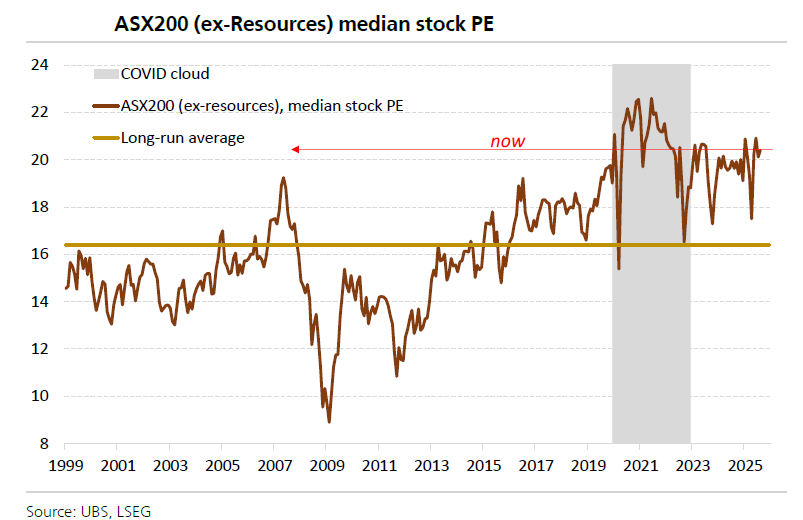
The amazing thing is that the earnings drought hasn’t stopped the market from performing relatively well. That’s been entirely due to an increase in the price that investors are willing to pay for the market. The ASX 200 now trades on a forward PE ratio of 19x compared to the long-run average of 15x. Prices for stocks outside of resources are even steeper.
For the Australian market to continue to go up, it will need to come from increased earnings, probably led by the resource companies. And that’s dependent on commodity prices, especially iron ore. Given the significant supply of iron ore coming to market over the next few years, not many are betting on higher prices going forward.
Overall, it makes for a challenging outlook for both US and Australian shares. Other equity markets look more prospective, especially Japan and Europe.
S&P 500 earnings growth rate
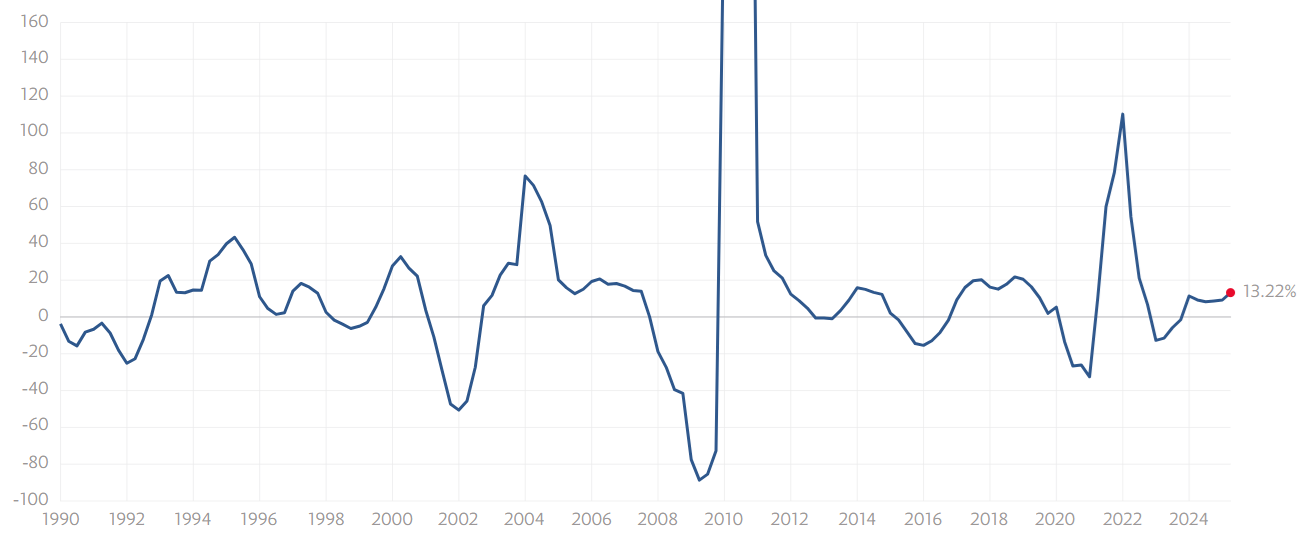
Source: Robert Shiller
S&P 500 Trailing PE ratio
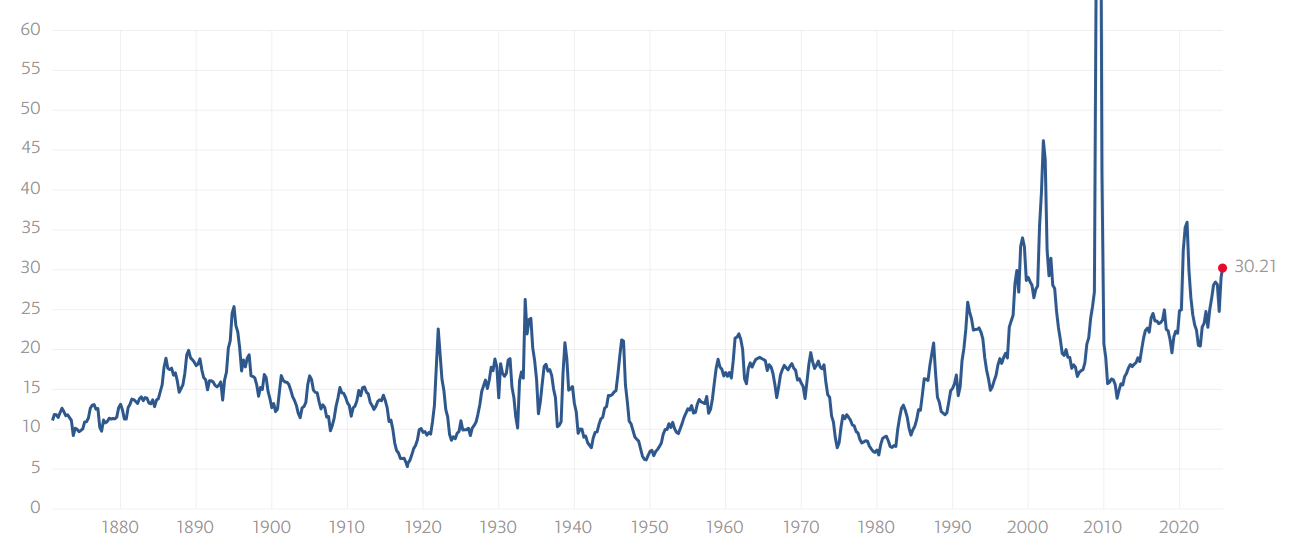
Source: Robert Shiller
****
In my article this week, I look at the prospects for the battered and bruised LICs sector and whether lower interest rates can deliver a long-awaited turnaround in its fortunes.
James Gruber
Also in this week's edition...
The blame game is underway following the stunning collapses of investment schemes, First Guardian and Shield. Clime's Michael Baragwanath says The Compensation Scheme of Last Resort was meant to protect the victims but hasn't, and it's time to design a fairer and faster system.
Every day, 700 Australians retire - most without a clear plan. Aaron Minney presents five charts breaking down the risks, realities, and strategies that could make or break your retirement.
Behind every political system and cultural norm might be a field of rice or wheat. Tomas Pueyo says these crops, dictated by climate, have quietly engineered how societies cooperate, govern, and grow - including in Australia.
Like John McClane crashing the Nakatomi Christmas party in the movie Die Hard, small caps stormed back into the market spotlight in August, delivering their best monthly gains in years. If historical patterns hold, Ophir's Andrew Mitchell says this could be the opening act of a much bigger comeback story.
First Sentier's Andrew Greenup thinks today’s new world order appears likely to lead to a lower return, higher risk investment environment. But he says one asset class looks especially well placed to survive, thrive, and deliver attractive returns to investors.
The four-day work week promises balance, rest, and unchanged productivity - but most trials have only tested this in ideal white-collar environments under short-term conditions. Professor Jenny George believes that until more people willingly trade income for time, it's an appealing idea whose time hasn’t yet come.
Two highlights from Morningstar this weekend. Nathan Zaia explains why ANZ's strategy shift isn't just about cutting costs, and Jon Mills gives his take on Anglo American's move to create a new copper mining heavyweight.
And, in this week's whitepaper, the private equity secondary market - involving the sale and purchase of investors' existing interests in illiquid alternative investment funds - is hot right now. Schroders investigates how it's disrupting the buyout market.
Curated by James Gruber and Leisa Bell
Latest updates
PDF version of Firstlinks Newsletter
Monthly Investment Products update from ASX
ASX Listed Bond and Hybrid rate sheet from NAB/nabtrade
Listed Investment Company (LIC) Indicative NTA Report from Bell Potter
Plus updates and announcements on the Sponsor Noticeboard on our website