From the early 1980s investment returns were spectacularly strong. Despite some bumps, like the 1987 crash, this was reflected in Australian balanced growth superannuation funds returning an average 14.1% pa in nominal terms and 9.4% pa after inflation between 1982 and 1999. And that was after taxes and fees.
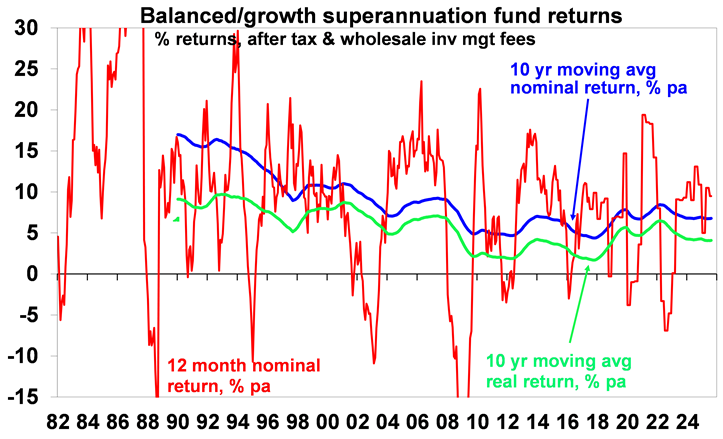
Source: Mercer Investment Consulting, Morningstar, Chant West, AMP
Since 2000 nominal super returns have been more constrained averaging 6.5% pa with real returns averaging 3.8% pa. This is still pretty good. Returns are likely to be similarly constrained over the next 5-10 years.
Why were returns from the early 1980s so strong?
There was an element of mean reversion (or payback) after the poor returns of the high inflation 1970s which left shares on low price to earnings ratios and bond yields very high. But fundamental drivers were:
- Supply side, economic rationalist policies - deregulation, privatisation, competition reforms, tax reform and free trade.
- Globalisation which boosted trade and competition and lowered costs.
- Easing geopolitical tensions with the ending of the Cold War in 1989.
- A corporate focus on return on capital.
- Positive demographics as baby boomers entered peak consumption and peak productivity.
- Inflation targeting by independent central banks with a focus on keeping inflation and inflation expectations at low levels.
- And, of course, the tech boom of the 1990s.
This drove strong productivity growth and low inflation which underpinned a secular bull market in shares through the 1980s and 1990s. It paused in the US in 2000-2013 but took off in Australia with the 2000s resources boom only to take off in the US again from 2013. Despite a brief inflation scare in 2022 its continued helped by AI optimism.
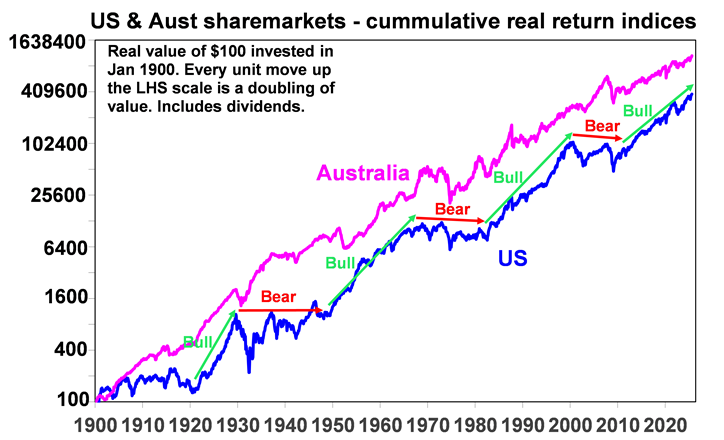
Since 1900 there have been four major secular bull markets in US shares: the 1920s (with electricity; chemicals and mass production); the 1950s and 60s (with petrochemicals, electronics and aviation); the 1980s and 90s (see the text); and since 2013. Source: Bloomberg, R Shiller, AMP
Mega trends – five key constraints on returns
Unfortunately, shares are no longer cheap, now trading on high PEs in the US and Australia, and the drivers of the strong returns from the early 1980s are reversing. On this front there are five key constraints.
1. Bigger government, less economic rationalist policies
Thanks to rising inequality, stagnant real wages, aging populations, climate change, the rise of populism partly fuelled by grievance driven social media and a collective memory loss regarding the lessons of the past there is a backlash against economic rationalist policies and more support for big government. It’s evident in the US with Trump’s tariffs and intervention in companies. It’s evident in Australia, with the rising public spending, support for higher taxes and labour market reregulation.
2. The reversal of globalisation
The post-WW2 surge in global trade saw production allocated globally according to comparative advantage. This helped cut inflation. But it stalled in the 2000s and trade barriers are rising. The pandemic, rising geopolitical tensions and nationalism are adding to this. Free trade is giving way to old-fashioned protectionism. This means higher costs.
3. Rising geopolitical tensions with a multipolar world
Declining military spending into the 2000s was disinflationary. This was facilitated by the move to a “unipolar” world dominated by the US and believe in free market liberalism. This started to fracture after the GFC, and we are now in a “multipolar” less stable world with arguably a new Cold War between China and its allies and Western countries. This is also driving increased military spending. This means more demand for metals and more government spending which will add to inflationary pressure.
4. Climate change and decarbonisation
Ultimately the shift to sustainable energy could result in lower costs. But we are a long way from that and climate change and the move to net zero will add to costs and inflation via: extreme weather events; associated rebuilding and higher insurance premiums; costs of mitigation; increased metals demand as economies retool; and increased pollution regulation.
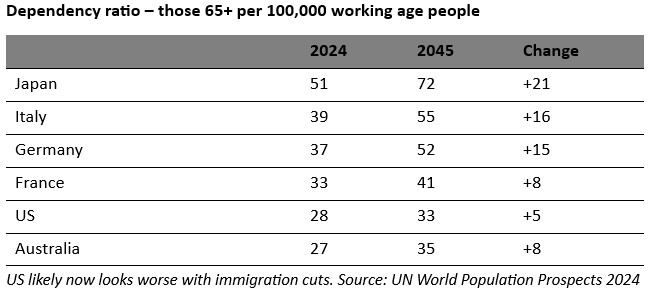
5. More consumers but less workers
Global population growth is slowing, while in advanced countries and China the working age population is declining. And populations are aging, resulting in rising ratio of retirees to workers (i.e. a rising dependency ratio). Thanks to its high immigration program Australia is in a somewhat better position. But globally, the upshot is less workers (supply) and more consumers (demand) which will add to inflationary pressures.
Implications for growth and inflation
Taken together these key mega trends risk further lowering productivity growth making economies more inflation prone. There is some offset with technological innovation – with artificial intelligence offering significant potential to boost services sector productivity, although this will take time to materialise. And the Australian Government following last month’s “Productivity summit” appears to recognise the need to reduce red tape. But the more inflation prone environment means central banks will have to work harder to keep inflation down, which will mean higher and possibly more variable interest rates than we saw pre-pandemic.
The collapse in inflation from the 1980s provided a tailwind for returns because the fall in interest rates and in related uncertainty allowed growth assets to trade on lower investment yields and higher price to earnings multiples (which boosted capital growth). A more inflation prone world will remove this tailwind with cash and fixed interest becoming relatively more attractive, price to earnings ratios on shares settling at lower levels and income yields on real assets at higher levels at some point (which will constrain capital growth). So far there is little sign of lower PEs although bond yields seem to be settling at higher levels.
What does all this mean for medium term returns?
Our approach to get a handle on medium term (i.e. 5-10 year) return potential of major asset classes is as follows:
- For cash, we use our forecast cash rate over the medium term.
- For bonds, the best predictor of future medium-term returns is current yields. The rise in yields has increased their return potential.
- For equities, the current dividend yields plus trend nominal GDP growth provides a rough guide to future medium-term returns.
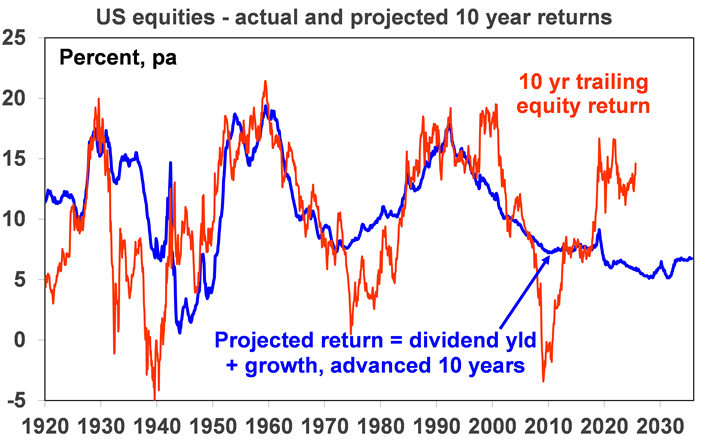
Source: Bloomberg, R Shiller, AMP
- For property, we use current rental yields and likely trend inflation as a proxy for income and capital growth.
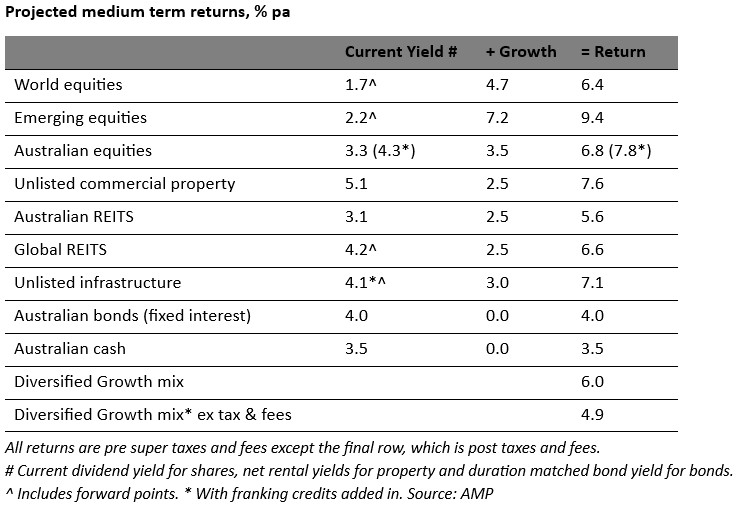
Our latest return projections are shown in the next table. The second column shows each asset’s current income yield, the third shows their 5–10-year growth potential, and the final column shows their total return potential. Note that: we assume inflation averages around 2.5% pa; and we have cautious real economic growth assumptions reflecting the five mega trends noted above. This will likely constrain capital growth.
Key observations
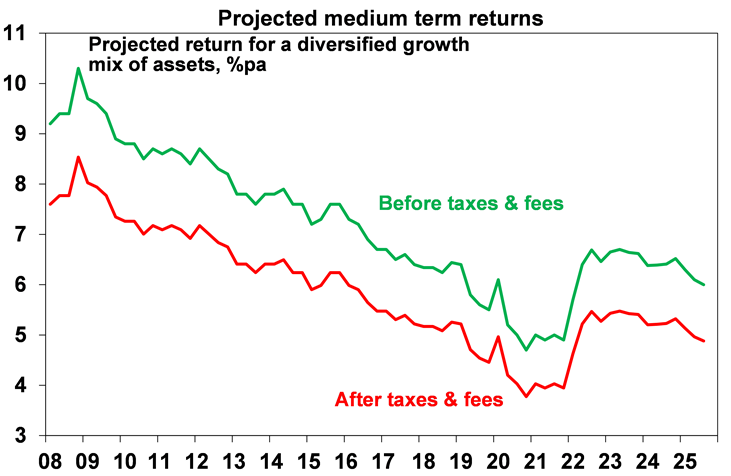
- After falling for many years (see next chart), the medium-term return potential using this approach improved after the 2022 inflation scare but the share market surge of the last few years has seen it fall back to around 6% pa for a balanced growth superannuation fund.
- After allowing for taxes and fees this implies nominal medium-term returns around 4.9% pa, a bit below the average since 2000. This is still better than bank term deposit rates which average 3.6% pre-tax.
Source: AMP
- The main medium term downside risk is that inflation rises again driving a rise in interest rates, bond yields and yields on shares, property and infrastructure resulting in a drag on capital growth.
Implications for investors
- First, have reasonable return expectations. In the past super returns were boosted by very favourable conditions which have faded.
- Second, remember there is no free lunch – investment opportunities offering higher returns likely entail much higher risk.
- Third, medium term returns from super are still likely to be well above bank term deposit rates on an after tax and fees basis.
- Finally, while bear markets when they occur are painful, they push up the medium-term return potential of shares and so can provide opportunities.
Dr Shane Oliver is Head of Investment Strategy and Chief Economist at AMP. This article has been prepared for the purpose of providing general information, without taking account of any particular investor’s objectives, financial situation or needs.